Why Following Michael Burry’s Social Media Cost Investors Everything – Beragampengetahuan
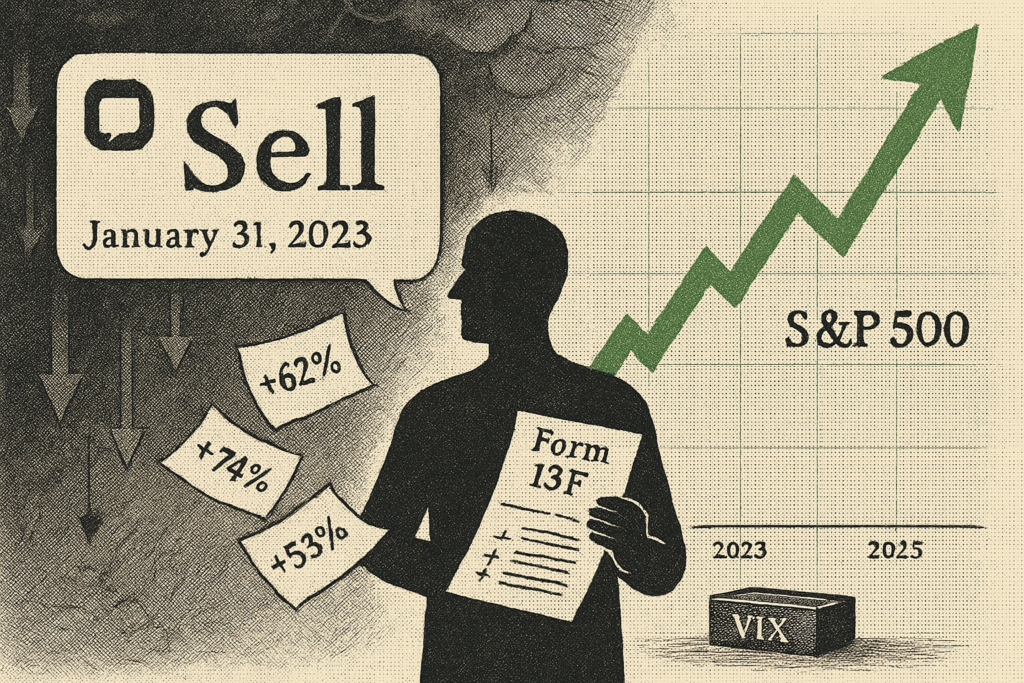
On January 31, 2023, Michael Burry—the guy who shorted the housing market and got immortalized by Christian Bale—tweeted one word to his 1.3 million followers: “Sell.”
The S&P 500 was at 4,076. Today it’s around 6,000. That’s a 70% rally.
If you followed his advice, you missed one of the most powerful bull runs in modern market history. You sat in cash or bonds earning 4-5% while the market compounded at roughly 25% annually for two consecutive years. On a $100,000 portfolio, that’s $70,000 left on the table.
Here’s the kicker: Burry’s own fund—Scion Asset Management—apparently crushed it during this period, with portfolio tracking data suggesting 50-60% returns in 2023 and 74% in 2024. While retail investors who followed his tweet got obliterated by opportunity cost, his four institutional clients were likely printing money.
This isn’t a hit piece on Burry. It’s about something more dangerous: the gap between what famous investors say publicly and what they actually do with their capital. And more importantly, how you can bridge that gap if you’re going to play this game at all.
Contents
The timeline: What he said versus what he did
Let’s walk through exactly what happened, quarter by quarter, using Burry’s mandatory 13F filings—the only window into what he was actually buying and selling.
Q1 2023 (January-March): The “Sell” tweet quarter
Burry posts “Sell” on January 31st, deletes his entire Twitter account the next day, and disappears. The financial media loses its mind. Retail investors dump positions.
His 13F filing (due 45 days after quarter-end, filed May 15) tells a completely different story. His portfolio expanded to $106.9 million across 21 holdings. He increased positions in JD.com and Alibaba—his top two holdings at 10% each. He added regional bank stocks. He was buying, not selling.
S&P 500 gain during this quarter: +7.5%.
Q2 2023 (April-June): The fake “Big Short 2.0”
August 14th filing reveals Burry opened massive put options against SPY (S&P 500 ETF) and QQQ (Nasdaq ETF)—specifically, 206,000 SPY puts and 186,000 QQQ puts with a combined notional value of $1.625 billion.
Every financial news outlet runs with the headline: “Michael Burry bets $1.6 billion on market crash.”
Here’s what they didn’t tell you: the notional value of an option position is meaningless for understanding actual capital at risk. Those puts probably cost him around $26-30 million in premiums, not $1.6 billion. That’s the actual money he spent. The notional value just represents the underlying shares controlled by the contracts.
And simultaneously, while everyone focused on his puts, he opened new long positions worth more than his put premiums: Expedia, MGM Resorts, CVS Health, Charter Communications, multiple energy stocks. He completely exited Alibaba and JD.com (his former top holdings) and rotated into deeply discounted US value stocks.
This wasn’t a pure short-the-market play. It was a hedge on concentrated long bets.
S&P 500 gain during this quarter: +8.7%.
Q3 2023 (July-September): The quiet retreat
November 14th filing drops with almost zero media coverage: Burry closed his entire SPY/QQQ put position.
The math: S&P 500 had rallied approximately 17% year-to-date when he likely exited (probably late August or September). Those puts almost certainly expired worthless or were closed at massive losses. Rough estimate: 40-50% loss on the $26-30 million he spent. Call it $10-12 million evaporated.
His portfolio value in the 13F shrank to $99 million across 13 holdings. He abandoned his macro bearish bet entirely after just three months and went back to stock-picking. His remaining bearish exposure was limited to small put positions on semiconductor ETFs.
Oh, and remember his “Sell” tweet? On March 30—just 58 days after posting it—he tweeted: “I was wrong to say sell. Going back to the 1920s, there has been no BTFD generation like you. Congratulations.”
S&P 500 gain during this quarter: +3.4% (October started rough but Q3 overall was positive).
Q4 2023 (October-December): The reversal
February 14, 2024 filing: Burry bought back Alibaba and JD.com—the same Chinese tech stocks he dumped in Q2—making them his #1 and #2 positions again. He opened 18 new positions including HCA Healthcare, Oracle, Citigroup, Warner Bros Discovery, and Alphabet.
His portfolio composition showed someone hunting deep value in beaten-down names, not someone hiding from a market crash.
S&P 500 gain during this quarter: +11.2%.
2024: The concentration play
Throughout 2024, Burry’s filings showed increasing concentration in Chinese tech (Alibaba, JD.com, Baidu comprising over 50% of some quarterly portfolios), healthcare (Molina, HCA), and sporadic options plays. His Q2 2024 portfolio hit peak concentration: just 10 holdings worth $52.5 million, with Alibaba alone at 21% of assets.
For context: the S&P 500 gained 23.3% in 2024, one of the best years on record. Burry’s tracked portfolio (based on replicating his disclosed positions with equal weighting) reportedly returned around 74%. His top holdings crushed: Alibaba up 17%, JD.com up 48%, Hudson Pacific Properties up 140%, The RealReal up 454%.
2025: Maximum whipsaw
Q1 2025: Burry liquidates almost all long stock positions and loads up on bearish puts—$97.5 million notional in Nvidia puts (50% of portfolio), plus puts against his former Chinese tech favorites. His only remaining long position: Estée Lauder.
Q2 2025: Complete philosophical reversal. He closes all bearish puts and flips to bullish call options worth $522 million notional—calls on UnitedHealth, Regeneron, Lululemon, Meta, ASML. Portfolio explodes to $578 million, up 190% from prior quarter.
Q3 2025 (filed November 14, 2025): Back to maximum bearish. Largest portfolio ever at $1.381 billion, dominated by $912 million notional in Palantir puts (5 million contracts) and $186 million in Nvidia puts. He’s betting massively against AI stocks trading at all-time highs.
Palantir since that filing was submitted: up approximately 30%. Nvidia: up 15%.
Why this keeps happening: The anatomy of financial misinformation
This isn’t unique to Burry. It happens with Cathie Wood, Bill Ackman, Ray Dalio, every “celebrity investor” with a social media presence. Here’s why retail investors get wrecked:
1. Timing lag creates false narratives
13F filings are due 45 days after quarter-end. That means when Burry’s Q1 2023 filing dropped on May 15, it only showed positions as of March 31. He could have completely changed his portfolio by May 15, but you wouldn’t know until mid-August.
When he tweeted “Sell” on January 31, his actual Q1 positions weren’t disclosed until May. By the time you see the filing, the trade thesis may be dead.
2. Notional value is meaningless for options
Financial media consistently reports options positions using notional value—the total value of underlying shares controlled—because it generates bigger headlines. “$1.6 billion bet against the market” gets more clicks than “$26 million hedge using put options.”
This creates the illusion of massive conviction when the reality is often tactical hedging or leveraged speculation with limited downside (the premium paid).
3. Public statements have zero fiduciary duty
When Burry tweets, he’s not acting as an investment advisor to you. There’s no duty of care, no suitability standard, no requirement that he disclose his actual positions or update you when he changes his mind. It’s entertainment, not advice.
His tweet said “Sell.” His portfolio said “buy JD.com and regional banks.” Nobody lied. But the gap between public persona and private action is where retail investors bleed.
4. Hedges get reported as directional bets
Burry’s Q2 2023 SPY/QQQ puts were almost certainly hedges against his long equity positions, not pure short bets. But the media narrative became “Burry bets against the market” because that’s a simpler, more dramatic story.
A sophisticated fund manager running a long/short book with tactical options hedges isn’t a headline. A guy who predicted 2008 shorting the market again is.
5. Track records create halo effects
Burry correctly called the subprime crisis. That was 17 years ago. His post-2008 track record includes plenty of bad calls: he was early (wrong) on inflation in 2010-2011, bearish on Tesla in 2021 while it rallied 50%, and obviously catastrophically early on his 2023 market crash prediction.
But the “Big Short” halo makes every new prediction seem oracular. Retail investors give him credibility he hasn’t earned in the current market cycle.
The protocol: How to actually track smart money
If you’re going to use institutional 13F filings or public commentary to inform your beragampengetahuan—and look, there’s nothing inherently wrong with that—you need a systematic protocol. Here’s what actually works:
Step 1: Understand what 13Fs show (and don’t show)
13F filings disclose:
- Long equity positions over $200,000 or 10,000 shares
- Equity call and put options (reported at notional value, not premium paid)
- Positions held as of the last day of the quarter
13F filings do NOT disclose:
- Short positions
- Non-equity holdings (bonds, commodities, cash, private investments)
- Exact entry/exit dates or prices during the quarter
- Position sizing/weighting decisions
- International holdings that aren’t US-listed ADRs
- Positions closed before quarter-end
This means you’re looking at a snapshot of one piece of a portfolio that may have already changed by the time you see it.
Step 2: Calculate actual options exposure, not notional
When you see options in a 13F, do this math:
For puts/calls reported:
- Notional value = (strike price × 100 shares per contract × number of contracts)
- Actual cost (premium) ≈ 1-5% of notional value for out-of-the-money options, 5-15% for at-the-money, higher for in-the-money
You’ll never know the exact premium paid, but you can estimate. When Burry’s Q2 2023 filing showed “$1.625 billion” in puts, the actual cash at risk was probably $20-40 million given that the puts were likely out-of-the-money hedges. That’s still significant for a ~$100M portfolio, but it’s not $1.6 billion.
Step 3: Track quarterly changes, not absolute positions
The value isn’t in seeing what someone owns. It’s in seeing what changed:
- New positions: Stocks that weren’t in the previous quarter’s filing
- Increased positions: Holdings where share count went up significantly (>25%)
- Decreased positions: Holdings where share count dropped
- Closed positions: Stocks completely exited
Create a simple spreadsheet:
| Ticker | Q1 Shares | Q2 Shares | Change % | New/Closed/Increased/Decreased |
|---|
This tells you where conviction is building or eroding. When Burry exited Alibaba in Q2 2023 then rebought it in Q4 2023, that’s a signal about his changing view on Chinese tech valuations and regulatory risk.
Step 4: Context matters more than positions
Don’t just track what they bought. Track:
- Macro environment: What were rates, inflation, sector rotation trends when they made the move?
- Stock-specific catalysts: Earnings, management changes, regulatory shifts
- Portfolio construction: Is this a 2% position or 20%? Concentrated or diversified?
- Historical patterns: Does this investor typically churn 90% of their portfolio quarterly (like Burry) or hold for years (like Buffett)?
Burry’s Chinese tech positions in 2023-2024 weren’t just “he likes Alibaba.” They were bets on: deeply depressed valuations (10-15x P/E), regulatory crackdown fears being overdone, US-China tensions being priced in, and mean reversion in a structurally profitable business. That’s a very different thesis than “follow Burry’s picks.”
Step 5: Wait for confirmation across multiple quarters
One quarter is noise. Two quarters is a pattern. Three quarters is conviction.
If an investor opens a new position at 5% of portfolio, then increases it to 10% next quarter, then 15% the quarter after, that’s a high-conviction build. If they open at 10% and close it next quarter, that was a trade gone wrong.
Burry’s Alibaba position: Held Q1 2023 at 9.6%, exited Q2 2023, rebought Q4 2023 as a top-3 holding, held through Q2 2024, added puts as a hedge in Q3 2024. That’s someone who wants exposure to the thesis but is managing risk around volatility.
Step 6: Cross-reference public statements with actual holdings
This is where you catch the contradictions. Simple exercise:
Date of public statement → Check the next 13F filing (usually 45-90 days later) → Compare.
Burry’s “Sell” tweet on January 31, 2023 → Q1 2023 filing showed increased positions and portfolio expansion → Direct contradiction.
When statements and positions align across multiple quarters, that’s signal. When they diverge, ignore the statements and track the positions.
Step 7: Accept that you’ll always be late
By the time you see a 13F, the position is 45+ days old. By the time you replicate it, the thesis may have played out. This strategy works for:
- Identifying long-term trends (investor X is rotating from growth to value)
- Learning investment frameworks (investor Y focuses on distressed retail with strong balance sheets)
- Confirming your own theses (if three smart investors are buying regional banks, maybe your regional bank thesis has merit)
This strategy does NOT work for:
- Short-term trading
- Copying positions mechanically without understanding the thesis
- Assuming positions will be held long enough for you to benefit
Step 8: Build a watchlist, not a copycat portfolio
Use 13F tracking to generate ideas, then do your own diligence. When you see a famous investor opening a new position:
- Research the company independently
- Understand the bear case and bull case
- Determine your own entry price, position size, and exit criteria
- Monitor the investor’s subsequent filings to see if they add, hold, or sell
- Adjust your position based on new information, not their moves
The goal isn’t to clone their portfolio. It’s to learn how sophisticated investors think about opportunity, risk, and timing—then apply those frameworks to your own decisions.
The real lesson: Process over personality
Michael Burry is a talented investor. His fund’s apparent outperformance from 2023-2025 suggests he navigated a complex macro environment successfully through stock selection, options strategies, and tactical positioning. His four institutional clients likely did fine.
But his public “Sell” tweet was catastrophically wrong for anyone who followed it. The S&P 500 is up 70% since January 31, 2023. That’s not a rounding error. That’s the difference between growing your portfolio by 70% and earning 4% in a money market fund.
The disconnect isn’t about honesty. Burry wasn’t lying when he tweeted “Sell”—he probably believed markets were overvalued and vulnerable (he still does, based on his October 2025 bubble warnings). But belief and profitable action are different things. His actual portfolio showed someone who stayed invested, rotated between sectors and geographies, used leverage via options, and took calculated risks on mispriced securities.
That’s the protocol: ignore the drama, track the positions, understand the lag, do your own work, and accept that even legendary investors can be wrong about timing while still generating alpha through stock-picking.
If you’re going to follow smart money, follow what they do, not what they say. And even then, understand that you’re always looking at yesterday’s decisions through a distorted mirror. By the time you see it, the trade may already be over.
The market doesn’t care about your heroes. It only cares whether you’re positioned correctly for what’s actually happening. Burry’s “Sell” tweet cost his followers 70%. His portfolio moves apparently made money. Learn from the second thing, not the first.
trading forex
seputar forex
stratégie forex gagnante, forex adalah, harga emas hari ini seputar forex
, forex factory, broker forex terbaik, forex factory calendar, harga emas forex, kalender forex, robot trading forex, forex calendar, seputar forex harga emas hari ini, berita forex hari ini
#Michael #Burrys #Social #Media #Cost #Investors